A form for presenting the project work schedule. Methods of presenting the schedule. Methodological basis for working with a Gantt chart
To determine the time of implementation of activities aimed at achieving the goals of the project, and to establish the relationships between them in terms of time, taking into account the most risky events, a project calendar plan is drawn up. Scheduling consists of creating and subsequently clarifying a schedule that takes into account the scope of work, risks, and limitations. Since a calendar plan in the form of a list of exclusively planned parameters of work without comparison with actual deadlines loses its meaning, the name calendar schedule is often used instead of a calendar plan.
As a result of creating a schedule, a complete project schedule is obtained, taking into account the duration of the work and the resource base necessary to complete the project. Scheduling, in general, includes several main stages, including:
- planning project content and building a structure,
- building a sequence of work and network schedule,
- drawing up a plan of deadlines, durations, coordinating the logical connections of work and displaying them on Gantt charts or tables,
- determining resource needs (personnel, machinery, materials, etc.) and drawing up a resource use plan,
- calculation of project labor costs and other costs.
After the project moves to the stage of practical implementation - execution of planned actions - the progress of work is monitored according to the calendar schedule, and corrective changes are made.
Planning the scope of work involves assigning responsible performers for tasks and deadlines. Tasks as a static category with their sequence are translated into a dynamic category of the state of work that leads to the result of the project. These work-formatted tasks are summarized in a schedule and/or table. Tasks express the essence of the results according to the performance criterion (“solved / not solved”). Accordingly, the start date for tasks is not as important as the end date.
As a rule, the schedule is drawn up by the project manager, who attracts experts in various fields for these purposes. Experts should help hierarchically build a complete list of work. Then the duration of the work and their interdependencies are determined. Some jobs can be done simultaneously (in parallel), while some can only be done sequentially. For clarity, these relationships are presented in the form of Gantt charts, in which a hierarchical list of tasks is located along one axis (vertically), and a calendar scale is located along the other axis. Based on the results of drawing up the schedule, you should get a calendar-oriented, hierarchically structured plan, including a complete list of works.
The project resource model is also part of scheduling. The need for performers for a particular stage of work and the degree of uniqueness of their qualifications, the availability of raw materials and consumables, mechanisms and equipment are taken into account. The resource base is assessed according to the characteristics of time (calendar or daily employment), costs of using resources, and maximum resource availability as a percentage.
In its simplest form, the parameters of the schedule are the start and completion dates of each work, the duration, and the resources required for these works. Complex calendar plans include several options for starting and completing work, their duration and time reserves. The method for calculating network models makes it possible to calculate only early and late dates. The original (baseline) planned dates and current dates must be selected taking into account other factors. There are three main options to choose from:
- By early start date. This is the earliest date from which work can begin. When you add the work duration parameter to it, you get an early completion date. The duration of the work depends on the number of workers and the total labor intensity, on the volume of work and the intensity of its implementation. Based on the early start date, a calendar plan is created to stimulate the performers involved in the project.
- By late completion date. The last date by which the work can be completed without delaying the project work is calculated by summing the latest start date and the duration. Selected to bring the project results as close as possible to the level of consumer needs.
- According to the most likely ending. Selected for resource smoothing.
 If the early and late start dates differ, the interval between them (the period when work can begin) becomes a slack time. In most planning systems, the initial statement is that the duration of the work will remain unchanged, and, therefore, the difference between the late and early start and the late and early completion of the work will coincide. Critical work (the duration of which indicates the duration of the project as a whole) becomes work with slack equal to zero. Accordingly, the critical duration is considered to be the minimum time required to complete the entire complex of work, and will have the length of the critical duration.
Technology for creating a project schedule
Since project management is based on the parameters of work content, restrictions and risks, the preparation of a calendar should be considered taking these parameters into account. The stages of plan development will also correspond to these parameters: stage No. 1 and No. 2 - the content of the work, stage No. 3 and No. 4 - restrictions, stage No. 5 - risks.
- Formation of a list of work scope. The list is important because if it is not possible to present all the work at once, errors will occur. To prevent this, when determining the composition of operations, the method of sequential decomposition of work is used.
- Determining the potential for project implementation based on the duration of work and their sequence, which, in turn, depends on the implementation technology. In addition to the mentioned method of sequential decomposition, the method of expert assessment, brainstorming, etc. is used to determine.
- Establishing resource availability. Project processes involve human, material, financial, information and other resources. Therefore, the work schedule must be correlated with the financing schedule. To do this, resources are differentiated - the concept of scarce resources is introduced. These include unique specialists, specific materials and capacities. The accessibility factor directly affects the sequence and duration of work.
- Definition of external restrictions. The most common restrictions are due to seasonality and the supply of materials and equipment. An example of a restriction on external events is the deadline for completing a stage, timed to coincide with a national holiday. Such events are included in the project as milestones.
- Risk response planning. For the main threats, it is necessary to develop a response plan, which also affects the calendar plan.
This phasing corresponds to the general logic of developing a calendar plan, which determines the following semantic sequence:
- Step 1. Determining the scope of work.
- Step 2. Estimation of the duration of work (labor costs).
- Step 3: Identify external constraints and milestones.
- Step 4. Arranging the sequence of work and calendar plan.
- Step 5. Recalculation and clarification of the calendar plan based on resource limitations.
- Step 6. Consider risks.
Since there are two opposing response strategies - active and passive - they are also reflected in the calendar plan. Thus, an active response involves the inclusion in the plan of additional work that is aimed at minimizing risks, and this, in turn, affects the timing of the related work. If we consider the inclusion of this accounting parameter using the example of introducing a new service to the market, then if a threat of lack of demand for the service is detected, additional research is carried out to minimize losses. This research, as a separate work, is included in the plan and changes it. Passive response also has an indirect effect on the plan, since it involves the creation of additional financial reserves for identified risks.
Documentary component of the calendar schedule
In order to determine the final estimated timing of the operations included in the project and its total duration, it is necessary to carry out final coordination and approval of the schedule document. Coordination with project participants determines the level of detail of the schedule, which should be sufficient, but not excessive. In other words, if the same resource is responsible for related activities, then there is no need for further division of higher-level work. If a task allocated for independent work must be transferred to another responsible person, then the separation process cannot yet be called completed. 
During the preliminary preparation of the schedule, a number of intermediate documents are created, including milestone plans, network models, WBS and others. The calendar plan itself becomes not only a planning document, but also a document for monitoring execution. The full documentation for the project schedule package includes:
- Consolidated (comprehensive) calendar plan.
- Detailed calendar schedules for each performer.
- Detailed schedules for work packages.
- Contracting plan.
- Information about resource needs.
- Organizational and technological measures for implementation.
- Work progress monitoring plan.
Thus, the project calendar plan is functionally needed for:
- instructions for performing specific actions,
- monitoring guideline and document for the conduct of control activities,
- basis for decisions to change the course of the project.
Using project management programs (for example, Microsoft Project), you can create an electronic form of the schedule in the form of a Gantt chart or tabular form. The “header” of the schedule in tabular form can consist of the columns “Work”, “Timelines” (divided by columns into start and end dates of work), “Responsible executors”, “Result”, “Fact of implementation”. Often, all works are numbered in separate columns, and a comment cell is left for each of them.
In practice, project planning management does not end with scheduling, since adjusting the budget and changing the schedule that depends on it involves going through several iterations.
The final plan is compiled into a consolidated comprehensive document after developing the organizational structure, supply planning, and risk assessment.
Surely, each of you already has your own project or idea that you are ready to implement. If not, then at the first stage of the lesson it is better to organize yourself into small groups and answer a series of questions using the “Time Swing” method. This method will allow you to give basic advice on where to start when implementing your idea.
At the next stage, try to model your future and answer a series of questions, recording your answers. Once you have answered all the questions, you will return to the present, where you will analyze your answers from the future, identifying steps to create it now.
“Swing of time” of the implemented project:
- What happened before the implementation of your project (idea) that did not suit you?
- What changes have occurred to the objects of your activity?
- Describe your ideal beneficiary.
- Write a review from someone who is happy with your project.
- Imagine that articles about your project are published in various media? What will the headline of such news be called?
- Thanks to whom was the project completed quickly and economically?
- How did you make your project popular?
- Who and how did you thank?
After you have answered the “swing” question, and “in the present” have received the key to the questions, you realize that everything begins right now, that the future depends on what you do today.
- Relevance
- Project goal
- Target audience of the project
- Get feedback from your loved one by including them in your project
- “Go through the words!” Don’t forget about a competent and bright presentation of your project. Write articles that will reflect your results. This will motivate you to implement your ideas.
- Do you need connections to implement the project?
- Ideas for your media plan
- Your team
Main part.
A project is a time-limited event aimed at creating unique products and services or obtaining fundamentally new results.
Does everyone understand why to manage a project? Can the project be carried out independently? Write down the key answers on the basis of which the concept of “project management” is formulated.
Project management is an activity in which clear project goals are defined and achieved while balancing scope, resources, time, quality and risks. The key factor for the success of project management is the presence of a clear predetermined plan, minimization of risks and deviations from the plan, and effective change management.
Project management stages:
- Initiation
- Planning
- Execution
- Monitoring and control
- Completion
Basic terms for working within the training course:
Cost (costs, expenses). In its simplest form, costs are the amount of resources spent on its implementation.
Timing (time)– the time interval required for the implementation of the project from the moment of its start.
Risks are uncertain events or conditions that, if realized, would have a positive or negative impact on at least one of the major areas of the project, such as scope, schedule, or cost.
To compactly describe the situation within which a specific project is to be developed and implemented, you can use a method such as SWOT analysis. The name of the method is derived from the first letters of English terms: strength, weakness, opportunities, threats. This method allows you to analyze the project from the perspective of each of the four parties mentioned above, which gives a complete picture of the situation and risks of the project.
Practical task.
Participants in the training course receive cards with an already developed SWOT analysis of a project. The task is to analyze the current situation of the project, whether it is viable, and present it to all participants in the process. Time to complete the task: 4 minutes. Time for presentation: 4 minutes.
Steps to develop a project schedule
A project schedule is a document that defines the planned start and completion dates for the entire project, work packages, and project activities. The schedule is used to evaluate the progress of the project.
The most common forms of presenting information about the project calendar are the network schedule and the Gantt chart.
Project network schedule
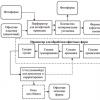
A schematic display of the chronological sequence of planned actions and their deadlines is called a project network schedule.
The figure shows a network plan; it is always created from left to right. On the graph, logical relationships are shown by arrows, and actions are shown by rectangles.
The network diagram highlights the so-called critical path, which corresponds to the longest sequential chain of project operations (actions) (in the figure, the critical path is highlighted with red rectangles).
Delaying activities on the critical path will extend the project duration.

Gantt chart
One of the most common forms of visual representation of a project schedule is the so-called “strip chart” or Gantt chart.
In appearance, a Gantt chart is a set of bars (“ribbons”) placed in a rectangular coordinate system, the location and length of which correspond to the time parameters of individual elements (phases, work packages, operations).
The general view of the Gantt chart is shown in the figure.
|
Description of operation |
Calendar units |
Project time frame |
||||
|
Work package (1) |
|
|
|
|
|
|
|
Work package (2) |
|
|
|
|||
|
Work package (3) |
|
|
||||
|
Work package (4) |
|
|||||
Practical exercise. Consolidation of knowledge.
The execution of the project is aimed at the direct creation of the product (service) for which the project is being implemented. First, the project team is recruited in accordance with the project plan, briefing is carried out, and work is launched. During the implementation of the work planned in the project plan, team interaction is being debugged, and measures are being implemented to eliminate unacceptable deviations from planned indicators. The main thing in project execution is the effective achievement of the intended goals.
This means that practical steps, according to the approved plan, should ensure the achievement of quality results within the established time frame through the use of allocated resources.
Monitoring and control are aimed at ensuring the execution of the project in accordance with the project plan, tracking certain project parameters that must be maintained within specified limits, as well as timely detection of possible problems and deviations, making decisions in response to changes arising in the project, quality control. During the control, the result is checked to determine the degree of its compliance with the planned indicators. Based on the results of such a check, a decision can be made either to bring the quality of the product or service to the required level, or to complete the project ahead of schedule.
Completion of the project includes procedures for drawing up final reports and conducting final settlements between project participants. A separate part of the final stage can be a generalization and description of the accumulated experience. The main part of the successful completion of the project is the transfer of the produced product (service) to the user for whom it was intended.
Think and write down what the social or other benefits of your project might be? Why do you think that the project’s product will be in demand?
Project success formula:
Project success = Project management success + In-demand project product
Formula for project failure:
Project failure = Unsuccessful plans + Project product that no one needs
The form in which the plan is presented influences its perception, and therefore the effectiveness of its implementation and control of execution. To increase the practical effect of the plan, the form of its presentation should take into account /3/: 1) the scale of the planned process (the number of necessary elements of the plan); 2) subject area of planning; 3) the nature of the plan elements (deterministic, random, uncertain); 4) features of the imagination and psychology of information perception by a specific group of potential plan implementers; 5) visibility and convenience of monitoring and adjusting the progress of the plan for the manager. Because of this, in practice the following forms of presenting plans are most widespread: ordinary (simple) presentation of plans, Gantt charts (cyclograms), schedules, network charts. At ordinary presentation of the plan its points are formulated in detail and written down either in the order of their execution, or grouped into sections in accordance with the field of activity (production, scientific, etc.), functional purpose (safety, development, marketing, etc.), performer (chief production, supply department, etc.). This plan can contain five columns. The first column contains the numbers of the plan items. The second column formulates the content of a specific plan item. In the third, fourth, fifth, write down, respectively, the deadline, the name or position of the responsible executor, the name or position of the controlling person (manager). The title page of such a plan should contain the approving and coordinating signatures of senior managers and managers, the name of the plan and other attributes and information necessary for the adoption and execution of the plan. Such a presentation of the plan does not allow one to easily and clearly establish the correspondence and logical relationship of the work and the time of its completion. Therefore, an ordinary presentation of plans is typical for simple processes or aggregated and simplified presented processes of a high level of hierarchy. Schedules in the form of presentation they are close to ordinary plans, but the list of works includes decisions on the results of the implementation of one or more works of the plan and auxiliary works (transfer of information, control of results, etc.), which make it possible to judge the mutual conditionality of the works included in the plan. Upon presentation Tana in the form of Gantt charts(cyclogram) in the leftmost column of the table write down the item numbers III. In the next column, the content of the plan items, the name of the work, and the equipment used are formulated. Then there are columns corresponding to the calendar time of the plan, for example, weeks, months, years. These columns indicate the start time of work on the plan item, and the duration of the work corresponds to the length of the horizontal segment shown on the plan. In management, the Gantt accounting and planning schedule is considered a tool for operational planning and production management. It can be used at all stages of operational production management: planning, dispatching, issuing work orders, monitoring work deadlines /1/. This presentation of the plan makes it possible to visualize the relationship between the times of individual work in the planned period and the loading of a specific sample of technological equipment, but does not allow one to establish logical relationships and interdependence of the work. Therefore, the plan representation in question can be most useful in a qualitative analysis of the uniformity of production capacity utilization, etc. Network planning/9,10/ allows you to establish logical relationships and interdependence of work execution, as well as estimate the time for completion of the relevant work and the plan as a whole. Therefore, the network planning system has found wide application in industrial enterprises, construction, research and design institutes. The plan in this case is depicted in the form of a network diagram, i.e., a network model or network. The main elements of the network model are: work, event, duration of work, various types of paths. Work in a network diagram is represented by an arrow. There are several types of this concept: real work, expectation, dependence, “fictitious work”. Under actual work refers to a process that requires time and resources. Expectation - a process that requires only time and does not require the use of resources (hardening of concrete, cooling of a part, etc.). Fictitious work(dependency) - a logical connection between two or more events. Fictitious work does not require any time or resources to be carried out. This type of work only indicates that a certain event (work) cannot begin without another event (work) occurring. Actual work and wait are shown in the network diagram as a solid arrow, and “dummy work” is shown as a dotted arrow. Event - this is a point in time that determines the possibility of starting or finishing a given job or several jobs. The duration of the event in time is zero. An event is indicated by a circle. The event number is written inside the circle. The use of the concept of “event” as the most important element of the plan significantly distinguishes the network diagram from other planning methods. An event delimits the activities of a plan. It is the result of the implementation of the previous work of the plan, as well as a necessary condition for the start of subsequent work. The event from which this work begins is called “initial”, and the one that completes this work is called “final”. In any network diagram there are two special events: initial and final. The initial event has no activities included in it and is designated as zero. This is the starting point for starting work on this network diagram. In the final event, only the jobs converge and none of them come out. The job number may consist of two digits. The first digit corresponds to the number of the initial event, the second - to the number of the final event. The most important element of a network diagram is the path - a continuous sequence of work. The path is determined by the direction of the arrows. Moreover, no path should pass through the same event twice. The length of the path is calculated as the sum of the duration of its constituent works. The duration of individual work is determined by various methods: normative, expert assessments, etc. The complexity of the work is indicated above the arrow line that indicates this work. There are several types of paths: preceding the event, complete, critical. Path preceding the event - sequence of work from the initial event to this event. Any path from the initial to the final event on a network diagram is called full. Critical is the path of the greatest length between the initial and final events. The critical path determines whether the work can be completed within the desired time frame. A delay in the implementation of any of the activities lying on the critical path leads to a violation of the deadlines for the implementation of this plan. Paths are usually denoted by Ln, where n are the numbers of events through which a given sequence of work passes. A simplified path designation is allowed - by listing the event numbers on a given path separated by a dash. When constructing a network diagram, a number of rules must be observed: 1. The general direction of the arrows reflecting the work (operations) should be from left to right, bottom to top, top to bottom. 2. The network diagram should not have unnecessary intersections of arrows. 3. All events, except the final one, must have subsequent work. 4. There should be no events in the network diagram, other than the initial one, that do not include any work (that is, tail events). 5. All events must have different numbers. 6. There should be no closed cycles in the network diagram, i.e. chains of work that would return to the event from which they came. The presence of such cycles indicates an error in the source data or incorrect structuring of many works. 7. If in a network diagram one event serves as the beginning of several jobs ending with another event (i.e., if it is necessary to display parallel jobs), then in this case an additional event and a “dummy job” are introduced. Primary networks are the most detailed. They are built at the level of specific performers, reflecting all the work and their relationships. Private networks are more enlarged: they combine the primary networks of a given object. Summary network combines a full range of works for a number of objects. Summary network is the most enlarged type of network. It is developed based on the integration (linking) of primary and private networks. The consolidated network is built in three stages /10/. At the first stage, the correctness of the primary schedules is checked. At the same time, the implementation of a set of rules for constructing networks is analyzed. Sequential numbers of events, the presence of events that do not include any work (except the initial one), events (except the final one) from which no work comes out, the correct display of parallel work, the presence of closed loops, etc. Detected inaccuracies are eliminated. At the second stage, the primary networks are integrated into a consolidated network, the final event of which corresponds to a given goal. At this stage, the complete coincidence of boundary events and activities is determined and verified. Boundary work called work in which the immediately preceding or subsequent events are boundary. Boundary event call an event belonging to two or more primary networks. From the primary network in the summary network diagram, boundary events and activities must be preserved. Therefore, the formulation of these events and activities in the primary networks is checked. At the third stage, networks are enlarged. The need for consolidation arises in cases where /10/: 1) the network diagram becomes poorly visible due to the large number of works and events included in it; 2) planning is carried out at various levels of the hierarchy. When solving this problem, it is necessary to follow a number of rules. Rule one: a group of interrelated jobs can be replaced by one job if this group has fixed input and output events, which can be represented on a larger network diagram as the start and end events of a new job. Second rule - input and output events for networks of different levels must be the same. Third rule - You cannot introduce events into the enlarged network that are not on the original network.3.14. RATING IN FORECASTING AND PLANNING
The decisive condition and basis for the development of sound plans is the continuous improvement of the regulatory framework. Taken together, production standards are intended to serve as a calculation basis for production planning and its organization, the basis for accounting and control of the use of production resources/9/. Based on technical and economic standards, the need for equipment, materials, tools is determined, and workers are placed in the production process. Their level characterizes the degree of production intensification. Labor standards are the basis for organizing wages. According to the standards, rational reserves of production resources are planned. Compliance with standards serves as the most important indicator when assessing the performance of each production unit and individual worker. The norm we will call the decision that determines the maximum permissible expenditure of labor (living or embodied) per unit of product (or type of work) or the minimum permissible yield of useful effect per unit of resource expended /9/. Standard Let us agree to call the decision regarding the relationship between the elements of the production process. There are two types of standards: 1) standard as a component of the standard characterizing the microelement of the costs of production and labor resources; 2) standard as an aggregated value calculated in relation to a complex indicator (working capital turnover standard). The norms and standards used in business practice must be reasonable, progressive, dynamic and systemic, i.e., cover the entire range of resources used. The validity of norms is determined by the correct choice of the object of regulation, the type of norm and the scientific method of its establishment. Grouping of standards can be carried out according to the object of regulation, period of validity, scale of application, degree of detail. According to the object of regulation, there are rules regulating the use of various types of resources and areas of work of production units. Labor standards are identified; use of tools, material and energy resources; organization of the production process as a whole; quality of finished products. The norms and standards for organizing the production process determine: the duration of the production cycle, the volume of work in progress balances, the volume of stocks of raw materials, supplies and fuel, scheduled standards for the launch and release of products, etc. Quality standards for finished products approve tolerances for parameters characterizing consumer properties products, their reliability, durability, safety. Financial standards regulate the relationship of the public insurance company with the budget and credit organizations (fees for funds, fixed payments, contributions to extra-budgetary funds, the ratio of own and borrowed funds, the size of the authorized capital, etc.). According to the period of validity, norms can be distinguished: operational, average annual (current) and long-term. According to the degree of detail (according to the degree of aggregation), it is customary to distinguish between detailed (operational), unit, unit, group and enlarged norms. Detailed(operational) standards establish the consumption of materials or labor required to manufacture a part (or a given operation of a technological process) in accordance with the drawings and specifications. Nodal and item-by-item They call the norms for the consumption of materials or labor costs necessary for the manufacture of a specific unit or product in accordance with the drawings and specifications. These two types of norms are used as operational ones. Group norms can be installed during the production of products of the same name of different standard sizes. They can be determined on the basis of individual standards as weighted averages. These standards are established for a group of products in physical or value terms and are used in medium-term (average annual) planning. Enlarged norms establish impersonal costs for an impersonal or conditional type of product. They are used to assess the efficiency of the fire protection system, an integrated analysis of the use of materials, fuel or other resources, and for predictive calculations. Based on the scale of application, standards and norms are divided into workshop, factory (OPS), inter-factory, inter-industry, sectoral, general industrial, standard /9/. Shop and factory standards are developed at a specific enterprise and take into account the characteristics of a specific production. Inter-industry norms and standards are developed in relation to the same type of production or for the same type of equipment, material consumption, etc. Industry norms regulate costs at all enterprises in the industry /9/. General industrial standards are developed for certain types of work and processes (loading and unloading, transport operations, etc.), characteristic of enterprises in different industries and carried out in approximately the same conditions. Model norm regulates the costs of production resources for the production of a standard group of homogeneous types of products under organizational and technical conditions that are characteristic of most enterprises. As a rule, there are unified and standard norms that determine the consumption of materials and labor costs for identical products produced in parallel by several enterprises. The system of production standards is not universal. Various industries have their own characteristics in the range of applied standards and in the methodology for determining their level. Methods for establishing technical and economic standards. The validity of norms and standards depends decisively on the methods of their development. In the practice of standardization work, the following methods are currently used: experimental, experimental-statistical, calculation-technical and analytical-calculation/9/. At experimental method the standard is determined on the basis of the experience of a craftsman, standard adjuster or technologist who observed the performance of similar work or the manufacture of the same type of product in the previous period of time. At experimental-statistical method statistical data is used on costs in past periods of working time or the number of products produced per unit of time, costs of materials per unit of output, etc. When calculation and technical method standards are established on the basis of calculations that determine the need for resources for the manufacture of each type of product. Calculation of the need for basic materials is made based on the size or weight of the finished product, the amount of waste determined from reference books or technical calculations. Analytical-calculation method involves determining some elements of the standard by technical calculation, and others based on an analysis of best practices and taking into account the achievements of the best similar industries. It must be taken into account that experimental and experimental-statistical methods for establishing standards require the presence of a reliable analogue of the standardized process. Their use in forecasting and planning of synergistic and asynergic systems and operations can lead to errors. In such cases, it is better to use calculation-technical or analytical-calculation methods, the method of expert assessments. The quality of standards must be analyzed. Outdated standards must be replaced by new ones. More preferable are the standards obtained by the analytical and calculation method. The use of these norms in forecasting and planning may also be different. When forecasting, more generalized norms (inter-industry, sectoral; calculation-technical and analytical) are often used, and when planning, more specific norms (factory, workshop; experimental, experimental-statistical). Forecasting and planning of management in a security organization is greatly influenced by its internal factors: goals, objectives, technologies used, specialized division of labor, organizational structure, volume of vertical management, and the need for horizontal coordination.CONCLUSIONS FOR CHAPTER 3
1. The main and objective property of any decision is its predictive nature. 2. Forecasting and planning increase the efficiency of the operational security system. 3. The importance of forecasting and planning increases with a relative lack or excess of resources, as well as with the development of scientific and technological progress. 4. The choice of forecasting method is a key decision in the forecasting process, made based on the forecasting goals, the volume and type of information available. 5. Forecasting by analogy is correct only after establishing the analogy of the forecast object and the analogue object.6. Heuristic forecasting methods allow the use of subconscious information and imagination for forecasting, and are used when the forecast object is too complex and cannot be formally described, and there is no time or means to develop formal models. 7. Individual expert (heuristic) methods are used for forecasting in relatively narrow areas of science and practice. 8. Collective expert assessments are used when forecasting objects and processes that are complex in nature and require interdisciplinary knowledge. 9. The main disadvantage of the round table method is the forecast errors due to the fact that experts in their judgments are initially focused on achieving a compromise. 10. Functional-logical forecasting of OPS allows forecasting to be carried out with a minimum amount of information and high complexity of the forecasting object and environment. 11. Structural methods make it possible to predict the structure of an object or process and their changes with known functions or based on the results of functional-logical forecasting. 12. Parametric forecasting methods allow you to predict changes in the parameters of the forecasting object (or process). 13. Complex forecasting systems are developed with a high degree of complexity of the object and (or) forecasting environment. 14. Planning is carried out based on the results of forecasting; depending on the conditions and object of planning, it can be divided into: strategic, business planning, long-term, current, operational. 15. The form in which the plan is presented plays an important role in the perception and improvement of control over its implementation. 16. Rationing is the basis of forecasting and planning. When forecasting, more generalized norms are used, and when planning, more specific norms are used.REFERENCES FOR CHAPTER 3
1. Meskon M.Kh., Albert M., Khedouri F. Fundamentals of management: Trans. from English-M.: “Delo”, 1993-702 p. 2. Sarkisyan S.A., Akhundov V.M., Minaev E.S. Analysis and forecast of the development of large technical systems. M.: Nauka, 1982-279 p. 3. Glushenko V.V. Forecasting, planning, success or forecasting and planning in market conditions. M.: hands. dep. in VINITI N 1581-B-96 dated 05/17/1996, 272 pp., collection of ref. M. 4. Workbook on forecasting / Editorial team: I.V. Bestuzhev-Lada (chief editor). - M.: Mysl, 1982.-430 p. 5. Chetyrkin E.M. Statistical forecasting methods. 2nd edition, M.: Statistics, 1977-200 p. 6. Rastrigin L.A., Ponomarev Yu.P. Extrapolation methods of design and management. - M.: Mechanical Engineering, 1986.-120 pp., ill. 7. F. Kotler. Marketing Basics. St. Petersburg, JSC "KORU-NA", JSC "LITERATURE PLUS", 1994, 698 p. 8. Business plan: Methodological materials / Ed. prof. R.G. Manilovsky. - M.: Finance and Statistics, 1994.-80 p. 9. Organization, planning and management of industrial enterprises. Textbook for universities. Ed. S.E. Kamenitsera, M., “Higher School”, 1976. 10. Larionov A.I., Yurchenko T.I. Economic and mathematical methods in planning. - M.: Vyssh. school, 1984.-224 p., ill.
Practical work № 1.1
GOAL: developing a general understanding of working with the MS Project program.
During this work you should learn:
· create, delete, move tasks; create, change, delete connections between tasks;
· change the duration and start dates of tasks using the mouse;
· create compound tasks; create and assign resources;
· manage the structure of data presentation in tables of different views.
Introduction
A project consists of tasks aimed at achieving a specific result. In order for a task to be completed, resources are allocated to it - material (equipment) and workers (employees). Allocating a resource to a task is called an assignment, and a task can have an unlimited number of assignments.
Tasks can be combined into groups or phases, and the task that combines others is called a summary (parent).
A task is characterized by duration, that is, the time required to complete it. Tasks with zero duration are called milestones. Milestones are used to indicate an important event in a calendar plan, such as the completion of a major milestone.
In addition, a task is characterized by the amount of labor (scope of work) and the costs or costs required to complete it.
In a project plan, tasks are linked using dependencies, which define the order in which tasks are performed relative to each other.
The duration of a project consists of the time intervals from the start of the earliest task to the end of the latest, taking into account dependencies between tasks. If increasing the duration of a task increases the duration of the entire project, the task is called critical.
Orderexecutionwork
Launch Microsoft Project. To create a ready-made educational project based on existing templates, use the command File -Create..., then in the task area on the panel Creating a Project in section Create with a template- General Templates select project New venture. Save the file in your working folder. Close the panel Creating a project.
Don't forget to save the file as you complete your work assignments!
1. On the left side of the MS Project window there is a View Panel,
containing icons that you can click to quickly switch between
various representations. By default the active view is
Gantt chart. To disable/enable the view bar
use View - View Panel.
Become familiar with the structure and purpose of basic views. Using a button Other performances... switch to views Task form. Form of resources. Task sheet. Return to the Gantt Chart view.
2. Project New venture has a complex task structure with
multi-level hierarchy. To control the display of the ktur s tasks
use the “Show subtasks” and “Hide subtasks” buttons
toolbar or menu item Project - Structure A.
Using the command Project - Structure- Show go to the second level task display mode.
3. The display of tasks on the Gantt chart can also be controlled. WITH
using the menu command View - Scale select this chart scale
Gantt so that the entire project is displayed in the window, and then, highlighting the Stage 2 task,
only the selected task. Watch how the time scale changes
Gantt charts.
The menu command is also used to control the time scale of the Gantt chart Format - Timeline or double-click in the timeline area located at the top of the Gantt chart window. The Timeline dialog box allows you to set the number of timeline levels, change the units of measurement for each scale level, and change the type of labels on the timeline.
Set the time scale of the Gantt chart that is convenient for you.
4. Using a command Project - Structure - Show go to mode
display of first level tasks. Open the task content Stage 3 -
Business planning - Development of a detailed business plan for 5 years. Add before task Listing the starting points task Compilation project summary lasting 4 hours.
To do this, click on the task line Listing the sourceprovisions, press the key Insert on the keyboard and enter data into the table about the name and duration of the task to be added. When adding a task in this way, MS Project automatically integrates the new task into the chain of sequential connections. To verify this, place the mouse cursor on the task Drawing up a project summary, execute the menu command Project -Task details. In the Task Details window that opens, go to the tab Predecessors and check that the task is specified as a predecessor Description of representation and perspective. Information about the relationship between tasks can also be obtained using the Gantt chart itself, located on the right side of the screen. Move your mouse cursor over the arrow showing the connection between tasks and read information about the connection characteristic.
5. The project summary, as a rule, is written after the entire
plan. So move the task Drawing up a project summary Thus,
so that it starts only after the end of the task Description of risks and
prospects.
To do this, you need to select the task Drafting a project summary and execute the menu command Edit - Cut task. Then select the task Publication of a business plan and run the command Edit - Paste. Check that the connection is correct.
Move tasks Development of sales and marketing strategy And Developmentdistribution structures in such a way that they precede the task Development of a pricing strategy.
6.
To remove links between tasks in MS Project there are several
opportunities.
6.1. Open the task details window Development of a start-up plan and make sure that on the tab Predecessors task specified Definitionlicensing requirements, type of connection “finish - beginning”, delay - About days. Select a task and run the command Edit - Break task links or click a similar button on the toolbar. At the same time, the task Development of a start-up plan will be completely removed from the sequential chain of related tasks and its start date will move to the beginning of the project. Cancel the deletion of the link or re-establish the link between the tasks.
6.2. Select a task Determining Licensing Requirements and go to the tab Predecessors the details window for this task. Click on
The network schedule does not contain a project schedule; it reflects only information for its development. Having decided on the deadlines, you can begin to draw up a work schedule in any of the listed formats.
^ Schedule of key events.
List of events and planned dates for their occurrence.
^ Work schedule. A list of jobs along with their start and end dates.
Have a Gantt chart. A graphical representation of work as lines on a timeline, indicating start, end, and possibly completion dates to date.
Have a Gantt chart with event markers. In addition to the above, key events are also indicated on the timeline.
In Fig. 4.12-4.14 presents the work schedule of your picnic in the formats of a schedule of key events, a work schedule and a Gantt chart, respectively.
When choosing a chart format, consider the following:
^ The key event schedule and work schedule are more suitable for displaying specific dates.
^ The Gantt chart gives a visual representation of the progress of several activities, and if they overlap each other, this is immediately visible. Key event Performer Due date (in minutes after the start) Comments You and your friend are ready to load things 10 Critical path to the car You and your friend are ready to go 15 Critical path End: you and your friend have arrived 45 Critical path to the lake Note: the graph reflects only key events, that you have defined for the project. Optionally, you can display events at the end of each job.
Rice. 4.12. Schedule of key events for organizing a picnic on the lake Work Performer Start date (in minutes after the start) End date (in minutes after the start) Comments 1. Load things You and your friend 10 15 Critical path into the car 2. Get money You 0 5 3. Prepare Your friend 15 25 egg sandwiches 4. Go to the lake You and your friend 15 45 Critical path 5. Choose a lake You and your friend 10 12 6. Fill up the car You 0 10 Critical path 7. Boil eggs Your friend 0 10 Critical path Fig. 4.13. Work schedule for organizing a picnic on the lake
Job/Event Get money Fuel the car Boil eggs Select a lake Load things into the car Make egg sandwiches Go to the lake
The critical path is highlighted in bold lines.
o 5 10 15 20 25 30 35 40 45 50 55 60 Time (minutes after start)
Rice. 4.14. Gantt chart for organizing a picnic on the lake
More on the topic Forms for presenting the project work schedule:
- Methods of development and forms of presentation of the structural diagram of work
- What work schedules will the exhibition team need; what should be included; in what form can a schedule be drawn up and why are milestones needed?